
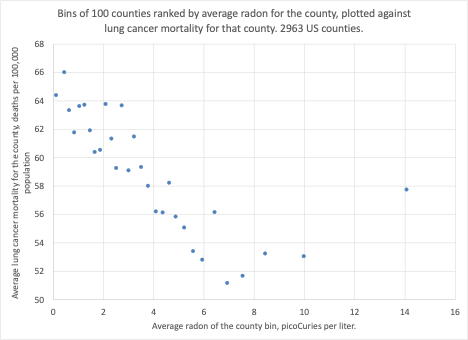
I was going through old files a while ago and I ran across this chart that I generated from data I had on hand. The data are at least 20 years old. The data are shown in the chart below.
I can imagine two responses after taking in what the data here seem to say:
- “Hmmm. That’s unexpected. It’s interesting. I expected the lowest lung cancer mortality to line up with the lowest average radon, and to slope upwards from there. You’re showing the opposite.”
- “Take this chart down. You have not provided a satisfactory level of supporting information. You have a responsibility to be silent on this matter unless your work passes a rigorous review, as it could greatly disturb the public on a public health matter that is important and is considered settled.”
Let me address number 2 first. Dear #2. You are right about satisfactory supporting information. I don’t even remember where this data came from exactly. The radon measurements were collected from companies that offer charcoal cannisters for exposure in the home, and who made their county data available to EPA for their use. I got the data from an EPA source. I don’t know if the readings were all living space, or if they included non-living-space foundation measurements. I do not have the count of readings for each county. The lung cancer mortality readings were taken from a CDC site. I simply excluded counties where either lung cancer mortality or radon measurements were unavailable. If such weak data sourcing were provided to me for academic peer review, I would reject. Moreover, the chart above uses bins to represent the data seen more completely in the chart below. A statistician would expect the data without bins, but with a regression line and regression coefficients; this bin business is suspect, suggesting the presenter (me) is more interested in impressing than informing.

The chart above uses linear regression, and shows the linear trend, very much in the direction seen in the bin chart above. The data seem, however, to bottom out and trend upwards where average radon levels are high. Here is the same chart using a polynomial regression, where the regression line can show us a peak or a valley, if that’s what the data are doing. The slightly higher R2 coefficient for polynomial regression tells us that we get a better fit when the valley is evident.

But dear Number 2. Though you are correct regarding the quality of the source of the data, please don’t tell me what I can and cannot show. My readers (all half-dozen of them or so) are not dummies. By your reckoning, there are only two approaches to publication about radon—peer-reviewed academic literature plus consumer-level guidance toward official practice, or silence. My reckoning is different.
Outlook #1. The science teacher at a local high school contacted me regarding doing a class project about radon. She would have the students measure radon in their own homes, and learn about radiation, alpha particles, correlations with health outcomes, and radon management in the foundation. I was supportive. It could be fun. It should be fun. It may involve questioning officialdom, but questioning officialdom is always fun. In between peer-review papers now requiring hundreds of citations, and intimidated silence, lies the real building science. This is the science of amateurs, of students, of playful curiosity, of exercising doubt while compiling evidence. A dusty old un-sourceable database fits right in. I hate how schools scurry to do planets, dinosaurs and volcanoes, when they could do science that touches on the current ecology and economy.
Let’s discuss this data, assuming we’re a group of students, or amateurs, not seeking publications on our CV, just having fun with data.
Does the data look good? Well, it has the right size and scale and range. It has a randomness that would be hard to create from scratch, assuming some nefarious hacker (or AI) wanted to sneak in and plant bad data. The means are reasonable and so are the spreads (standard deviations). I can’t put my hands on the same data for recent years, though I would relish doing so.
Isn’t radon like poison, where it’s all bad, and the badness is proportional to the dose? There are poisons for the body with no concentration showing benefits—lead and arsenic, for example. But there are also “poisons” that are detrimental at high concentrations but are beneficial, indeed necessary, at low concentrations—iron and iodine.
This data suggests that radon is not like poison, but has a sweet range somewhere beyond 4 pCi/L. We are organisms, and as organisms, we adapt to our environment, and there is background radon in our environment. The background above ground is quite lower than 4 pCi/L, but we share genetic material with worms and nematodes and voles and moles, for whom the radon environment is higher. Radon does lung cancer damage by getting inhaled, decaying to polonium, a solid which can be deposited directly on the alveoli, where it then decays to lead, emitting an alpha particle. The alpha particle can club the DNA in the lung cells. Then the cell DNA goes through its repair sequence (every day or so? Longer?) We know for sure that at high concentrations of radon, repair cannot keep up with damage, and the lung cells suffer. Could the repair sequence be prompted more at medium high concentrations than at low? Damned if I know. But these data do suggest there are benefits at mid-range radon, around 4 pCi/L, not evident at lower concentrations.
The radon and health discussion centers around the Linear No-Threshold assumption (LNT) according to which a detrimental environmental factor is assumed to have no beneficial effects at any concentration, and the damage is linearly related to the dose. Note that that is an assumption—a factor that is brought to the analysis, not one derived from the analysis. I can picture a scenario under which LNT gained prominence as nuclear power grew. Maybe it was like this: Both nuclear weapons and nuclear energy risk leave radioactive residue. If a little bit of that residue was actually good for you, well, someone using nuclear weapons against an enemy might say they are doing them a favor, or someone developing nuclear energy might argue that their carelessness in containing radioactive byproducts was actually benefitting the population. It’s better to impose bans on nuclear weapons, and a zero limit on emissions. I concur. But I’m not ready to disfigure data in support of desirable policy objectives.
Are there alternate explanations for the data, assuming it has standing? Perhaps. Here’s one. The US has, let’s say, bottom land and high land. Bottom land, near rivers, is mucky with low porosity, so very little radon is carried through the soil. Bottom land is also where poor people live, poor people smoke, and smoking causes lung cancer. Higher land has higher porosity, and draws a wealthier, perhaps healthier, population. In any case, studies comparing radon to lung cancer morbidity and mortality must pay very close attention to smoking.
What does the literature say?
- The official congregate positions are found in the BEIR reports—Biologic Effects of Ionizing Radiation—published by the National Academies of Science, online at: https://nap.nationalacademies.org/resource/11340/beir_vii_final.pdf The current report is BEIR VII. Their summary states this:
At doses of 100 mSv1 or less, statistical limitations make it difficult to evaluate cancer risk in humans. A comprehensive review of available biological and bio-physical data led the committee to conclude that the risk would continue in a linear fashion at lower doses without a threshold and that the smallest dose has the potential to cause a small increase in risk to humans. This assumption is termed the “linear-no-threshold” (LNT) model.
There are two competing hypotheses to the linear no-threshold model. One is that low doses of radiation are more harmful than a linear, no-threshold model of effects would suggest. BEIR VII finds that the radiation health effects research, taken as a whole, does not support this hypothesis. The other hypothesis suggests that risks are smaller than predicted by the linear no-threshold model, are nonexistent, or that low doses of radiation may even be beneficial. The report concludes that the preponderance of information indicates that there will be some risk, even at low doses, although the risk is small.
- The strongest challenge to LNT that I am familiar with is the work of Dr. Bernard Cohen, now deceased, formerly with the University of Pittsburgh. “The linear no-threshold theory of radiation carcinogenesis should be rejected”. https://www.jpands.org/vol13no3/cohen.pdf
- The most prominent field study comparing monitored radon in homes to lung cancer occurrence and mortality, from year 2000, was the Iowa Study “Residential radon gas exposure and lung cancer: the Iowa Radon Lung Cancer Study”. https://pubmed.ncbi.nlm.nih.gov/10873134/ The main author, Bill Field whom I got to know, is recently deceased. I found the statistician for the project –Smith—to be unhelpful. This report had a big impact when it appeared, as it claimed to show support, not only for LNT but also for a 4 pCi/L threshold. It should be read with a critical eye; there are many questions arising from the study, starting with smoking.
- I once looked into finding the source of 4 pCi/L as the radon action level, the target maximum indoor living-space concentration. It was the Federal Register 1983 (40 CFR Part 192). PART 192—HEALTH AND ENVIRONMENTAL PROTECTION STANDARDS FOR URANIUM AND THORIUM MILL TAILINGS https://www.ecfr.gov/current/title-40/chapter-I/subchapter-F/part-192. Mill tailings from uranium mining were deposited near Native American grounds, and, under the Carter Administration, these were ordered to be cleaned up. A cleanup requires targeting a clearance criterion, and, based on LNT and the funds available to do the work, that criterion was chosen as 0.02 WL (working levels). Multiplying this value by 100 and dividing by an “equilibrium ratio” of 0.5 gives radon concentration of 4 pCi/L. Note that the 4pCi/L value was derived solely from money available for the cleanup together with LNT, not from health studies.
I hope to have conveyed here the importance I attach to amateur science, especially when it brushes up against conventional wisdom, the powers that be, and money-making industries that rely on science they considered settled. The earth is spherical—that’s settled—but skepticism is overdue on many of the small facets of our lives and our environment. Any good scientist will relish a decently-prepared challenge from a novice. I hope that that good scientist would encourage the novice to pursue the matter further, provide helpful information, and offer to stay in touch. Then go home and recall the challenge as the highlight of her day.
- Dose, or exposure, is measured in milliseiverts (mSv), while picoCuries per liter (pCi/L) measures a radiation density (rate of radioactive decay per volume). To convert, you’d need to know how for how long was an individual exposed to a certain radiation density. ↩︎

Leave a reply to joe52ca020d0216 Cancel reply